

Background
In this article we are going to discuss how to write a debugger for VB6 P-code. This has been something I have always wanted to do ever since I first saw the WKTVBDE P-Code Debugger written by Mr Silver and Mr Snow back in the early 2000’s
There was something kind of magical about that debugger when I first saw it. It was early in my career, I loved programming in VB6, and reversing it was a mysterious dark art.
While on sabbatical I finally I found the time to sit down and study the topic in depth. I am now sharing what I discovered along the way.
This article will build heavily on the previous paper titled VB P-Code Disassembly[1]. In this paper we detailed how the run time processes P-Code and transfers execution between the different handlers.
It is this execution flow that we will target to gain control with our debugger.
An example of the debugger architecture detailed in this paper can be found in the free vbdec pcode disassembler and debugger
Probing
When I started researching this topic I wanted to first examine what a process running within the WKTVBDE P-Code debugger looked like.
A test P-Code executable was placed alongside a copy of the VB runtime with debug symbols[2]. The executable was launched under WKTVBDE and then a native debugger was attached.
Examining the P-Code function pointer tables at 0x66106D14 revealed all the pointers had been patched to a single function inside the WKTVBDE.dll
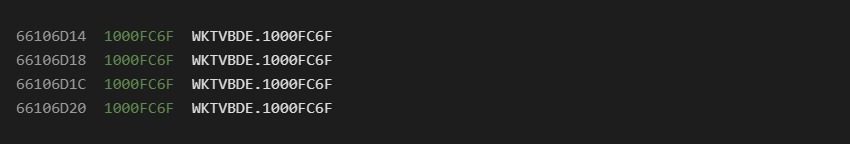
This gives us our first hint at how they implemented their debugger. It is also worth noting at this point that the WKTVBDE debugger runs entirely within the process being debugged, GUI and all!
To start the debugger, you run loader.exe and specify your target executable. It will then start the process and inject the WKTVBDE.dll within it. Once loaded WKTVBDE.dll will hook the entire base P-Code handler table with its own function giving it first access to whatever P-Code is about to execute.
The debugger also contains:
- a
P-Codedisassembler - ability to parse all of the nested
VBinternal structures - ability to list all code objects and control events (like on timer or button click)
This is in addition to the normal debugger UI actions such as data dumping, breakpoint management, stack display etc.
This is A LOT of complex code to run as an injection dll. Debugging all of this would have been quite a lot of work for sure.
With a basic idea of how the debugger operated, I began searching the web to find any other information I could. I was happy to find an old article by Mr Silver on Woodmann that I have mirrored for posterity [3].
In this article Mr Silver lays out the history of their efforts in writing a P-Code debugger and gives a template of the hook function they used. This was a very interesting read and gave me a good place to start.
Design Considerations:
Looking forward there were some design considerations I wanted to change in this architecture.
The first change would be that I would want to move all of the structure parsing, disassembler engine, and user interface code into its own stand alone process. These are complicated tasks and would be very hard to debug as a DLL injection.
To accomplish this task we need an easy to use, stable inter-process communication (IPC) technique that is inherently synchronous. My favorite technique in this category is using Windows Messages which automatically cause the external process to wait until the window procedure has completed before it returns.
I have used this technique extensively to stall malware after it unpacks itself [4]. I have even wired it up to a Javascript engine that interfaces with a remote instance of IDA [5].
This design will give us the opportunity to freely write and debug the file format parsing, disassembly engine, and user interface code completely independent of the debugger core.
At this point debugger integration essentially becomes an add on capability of the disassembler. The injection dll now only has to intercept execution and communicate with the main interface.
For the remainder of this paper we will assume that a fully operational disassembler has already been created and only focus on the debugger specific details.
For discussions on how to implement a disassembler and a reference implementation on structure parsing please refer to the previous paper [1].
Implementation
With sufficient information now in hand it was time to start experimenting with gaining control over the execution flow.
Our first task is figuring out how to hook the P-Code function pointer table. Before we can hook it, we actually need to be able to find it first! This can be accomplished in several ways. From the WKTVBDE authors paper it sounds like they progressed in three main stages. First they started with a manually patched copy of the VB run time and the modified dll referenced in the import table.
Second they then progressed to a single supported copy of the run time with hard coded offsets to patch. A loader now injecting the debugger dll into the target process. Finally they added the ability to dynamically locate and patch the table regardless of run time version.
This is a good experimental progression which they detail in depth. The second stage is readily accessible to anyone who can understand this paper and will work sufficiently well. I will leave the details of injection and hooking as an exercise to the reader.
The basic steps are:
- set the memory writable
- copy the original function pointer table
- replace original handlers with your own hook procedures
The published sample also made use of self modifying code, which we will seek to avoid. To get around this we will introduce individual hook stubs, 1 per table, to record some additional data.
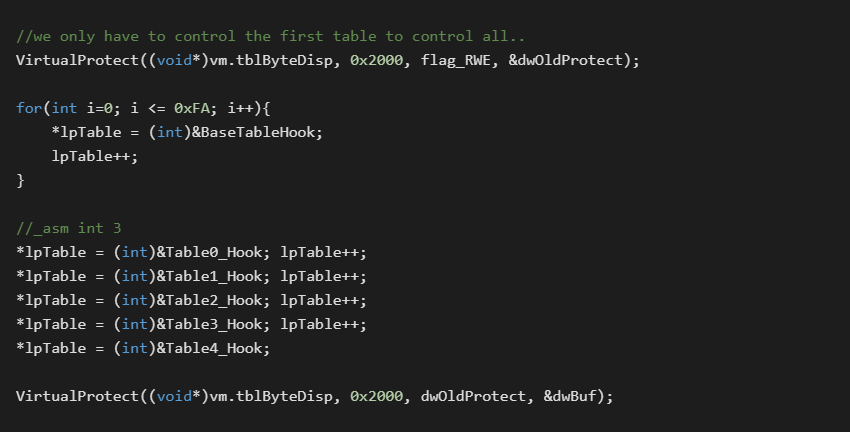
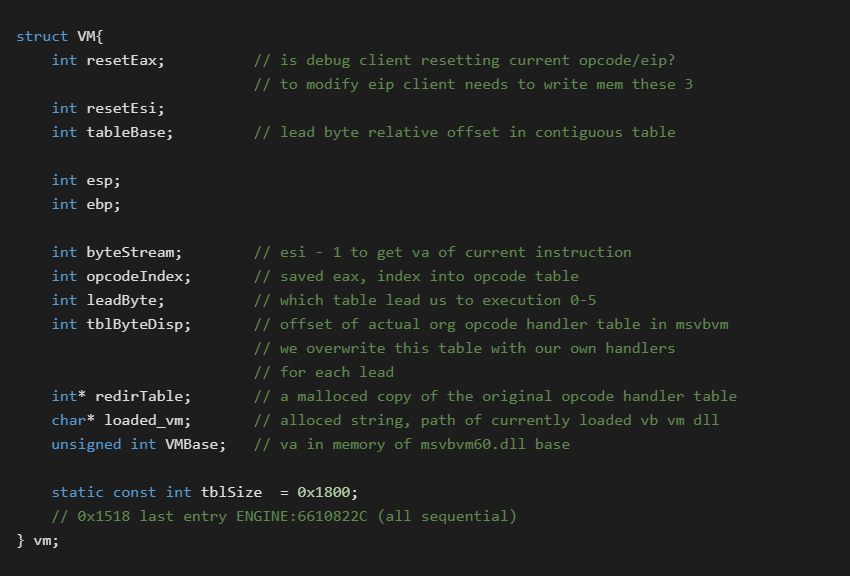
Before we get into the individual hook stubs, we notice they stored some run time/state information in a global structure. We will expand on this with the following:
From the hooking code you will notice that all of the base opcodes in the first table (excluding lead byte handlers) all received the same hook. The Lead_X bytes at the end each received their own procedure.
Below shows samples of the hook handlers for the first two tables. The other 4 follow the same pattern:
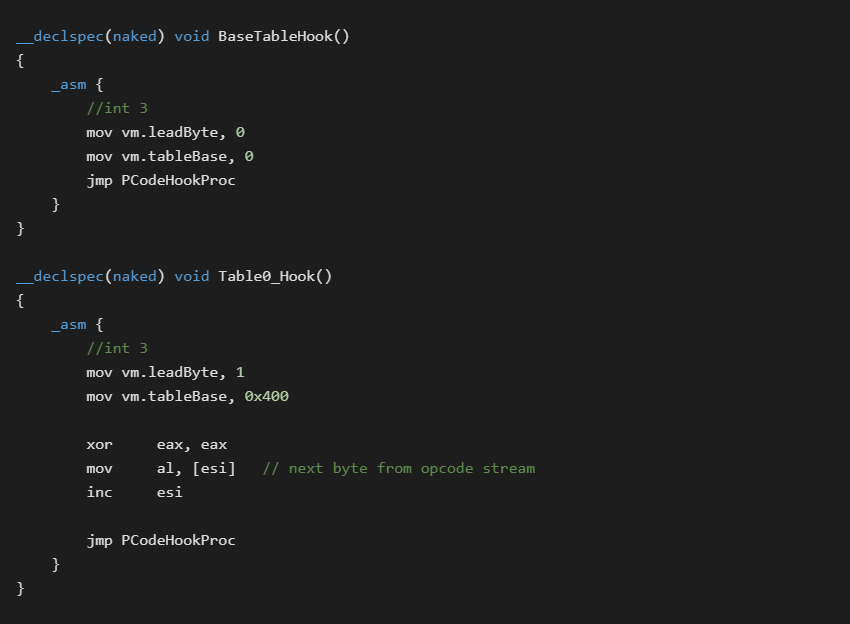
The hooks for each individual table configure the global VM structure fields for current lead byte and table base. The real meat of the implementation now starts in the universal hook procedure.
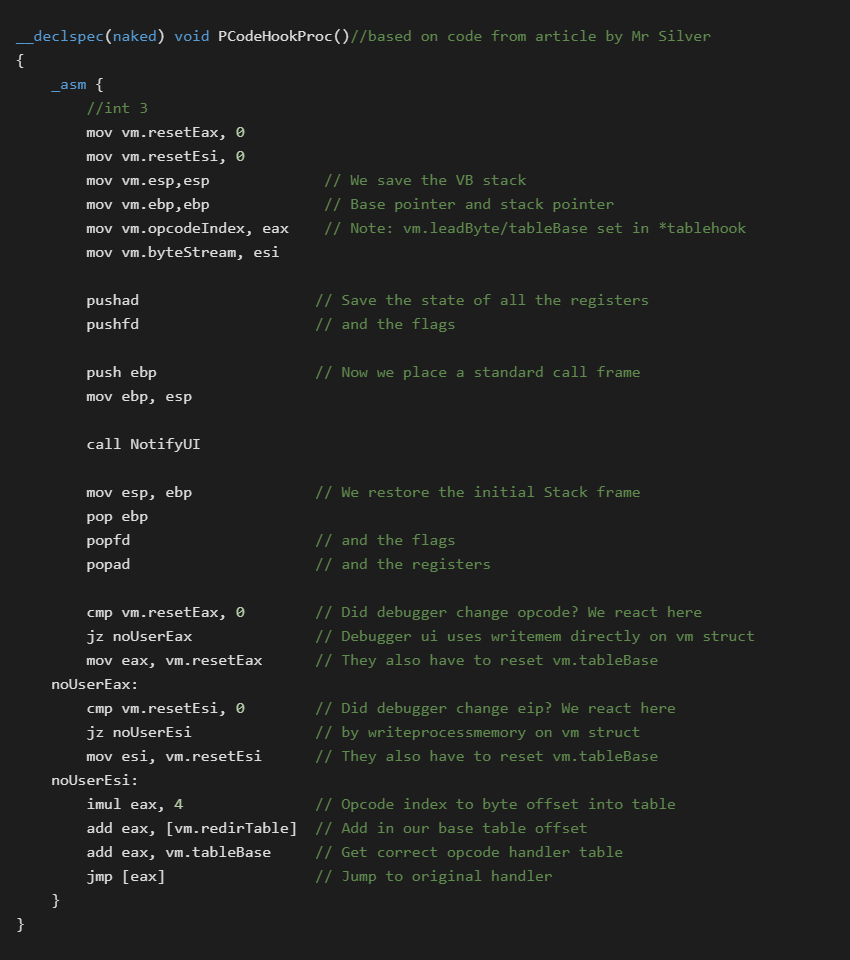
In the main PCodeHookProc you will notice that we call out to another function defined as: void NotifyUI().
It is in this function where we do things like check for breakpoints, handle single stepping etc. This function then uses the synchronous IPC to talk to the out of process debugger user interface.
The debugger UI will receive the step notification and then go into a wait loop until the user gives a step/go/stop command. This has the effect of freezing the debugee until the SendMessage handler returns. You can find a sample implementation of this in the SysAnalyzer ApiLogger source [6].
The reason we call out to another function from PCodeHookProc is because it is written as a naked function in assembler. Once free from this we can now easily implement more complex logic in C.
Further steps:
Once all of the hooks are implemented you still need a way to exercise control over the debuggee. When the code is being remotely frozen, the remote GUI is actually still free to send the frozen process new commands over a separate IPC back channel.
In this manner you can manage breakpoints, change step modes, and implement lookup services through runtime exports such as rtcTypeName.
The hook dll can also patch in custom opcodes. The code below adds our own one byte NOP instruction at unused slot 0x01
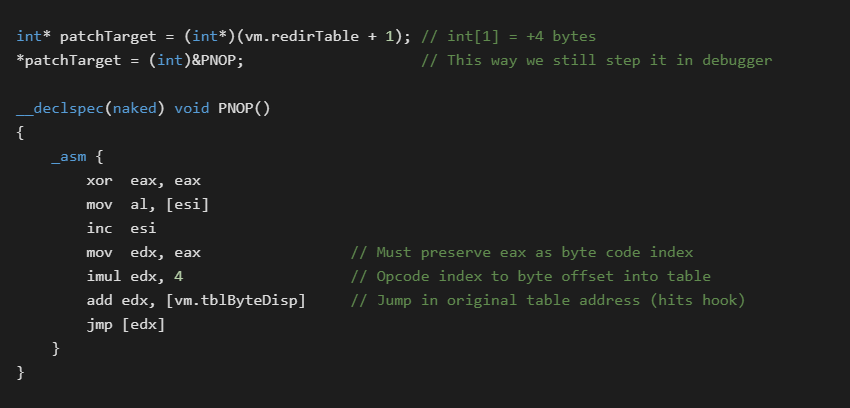
As hinted at in the comments, features such as live patching of the current opcode, and “Set New Origin Here” type features are both possible. These are implemented by the debugger doing direct WriteProcessMemory calls to the global VM struct. The address of this structure was disclosed in initialization messages at startup.
Conclusion
Writing a P-Code debugger is a very interesting concept. It is something that I personally wanted to do for the better part of 20 years.
Once you see all the moving parts up close it is not quite as daunting as it may seem at first glance.
Having a working P-Code debugger is also a foundational step to learning how the P-Code instruction set really works. Being able to watch VB6 P-code run live with integrated stack diffing and data viewer tools is very instructive. Single stepping at this level of granularity gives you a much clearer, higher level overview of what is going on.
While the hook code itself is technically challenging, there are substantial tasks required up front just to get you into the game.
Prerequisites for this include:
- accurate parsing of an undocumented file format
- a solid disassembly engine for an undocumented
P-Codeinstruction set - user interface that allows for easy data display and debugger control
For a reverse engineer, a project such as this is like candy. There are so many aspects to analyze and work on. So many undocumented things to explore. A puzzle with a thousand pieces.
What capabilities can be squeezed out of it? How much more is there to discover?
For me it is a pretty fascinating journey that also brings me closer to the language that I love. Hopefully these articles will inspire others and enable them to explore as well.
[1] – VB P-Code Disassembly
[2] – VB6 runtime with symbols (MD5: EEBEB73979D0AD3C74B248EBF1B6E770)
[3] – VB P-code Information by Mr Silver
[4] – ApiLogger – Breaking into Malware
[5] – IDA JScript
[6] – SysAnalyzer ApiLogger – freeze remote process