
In this article we are going to discuss the inner depths of VB6 P-Code disassembly and the VB6 runtime.
As a malware analyst, VB6 in general, and P-Code in particular, has always been a problem area. It is not well documented and the publicly available tooling did not give me the clarity I really desired.
In several places throughout this paper there may be VB runtime offsets presented. All offsets are to a reference copy with md5: EEBEB73979D0AD3C74B248EBF1B6E770 [1]. Microsoft has been kind enough to provide debug symbols with this version for the .ENGINE P-Code handlers.
To really delve into this topic we are going to have to cover several areas.
The general layout will cover:
- how the runtime executes a P-Code stream
- how P-Code handlers are written
- primer on the P-Code instruction set
- instruction groupings
- internal runtime conventions
- how to debug handlers
Native Opcode Handlers & Code Flow
Let’s start with how a runtime handler interprets the P-Code stream.
While in future articles we will detail how the transition is made from native code to P-Code. For our purposes here, we will look at individual opcode handlers once the P-Code interpretation has already begun.
For our first example, consider the following P-Code disassembly:

Here we can see two byte codes at virtual address 0x401932. These have been decoded to the instruction LitI2_Byte 255. 0xF4 is the opcode byte. 0xFF is the hardcoded argument passed in the byte stream.
The opcode handler for this instruction is the following:
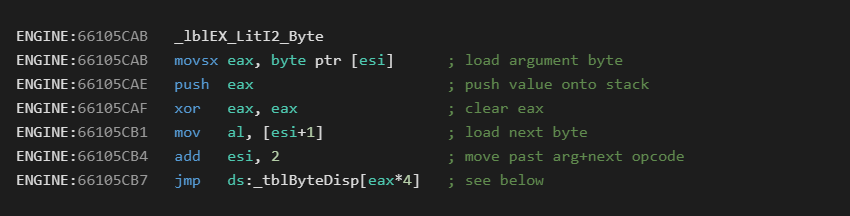
While in a handler, the ESI register will always start as the virtual address of the next byte to interpret. In the case above, it would be 0x401933 since the 0xF4 byte has already been processed to get us into this handler.
The first instruction at 0x66105CAB will load a single byte from the P-Code byte stream into the EAX register. This value is then pushed onto the stack. This is the functional operation of this opcode.
EAX is then cleared and the next value from the byte stream is loaded into the lower part of EAX (AL). This will be the opcode byte that takes us to the next native handler.
The byte stream pointer is then incremented by two. This will set ESI past the one byte argument, and past the next opcode which has already been consumed.
Finally, the jmp instruction will transfer execution to the next handler by using the opcode as an array index into a function pointer table.
Now that last sentence is a bit of a mouth full, so lets include an example. Below is the first few entries from the _tblByteDisp table. This table is an array of 4 byte function pointers.
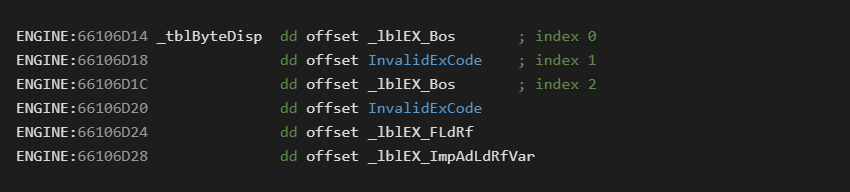
Each opcode is an index into this table. The *4 in the jump statement is because each function pointer is 4 bytes (32 bit code).
The only way we know the names of each of these P-Code instructions is because Microsoft included the handler names in the debug symbols for a precious few versions of the runtime.
The snippet above also reveals several characteristics of the opcode layout to be aware of. First note, there are invalid slots such as opcode 0x01-InvalidExCode. The reason for this is unknown, but it also means we can have some fun with the runtime such as introducing our own opcodes [5].
The second thing to notice is that multiple opcodes can point to the same handlers such as the case with lblEX_Bos. Here we see that opcode 0 leads to the same place as opcode 2. There are actually 5 opcode sequences which point to the BoS (Beginning of Statement) handler.
The next thing to notice is that the opcode names are abbreviated and will require some deciphering to learn how to read them.
Finally from the LitI2_Byte handler we already analyzed, we can recognize that all of the stubs were hand written in assembler.
From here, the next question is how many handlers are there? If each opcode is a single byte, there can only be a maximum of 256 handlers right? That would make sense, but is incorrect.
If we look at the last 5 entries in the _tblByteDisp table we find this:

The handler for each of these looks similar to the following:
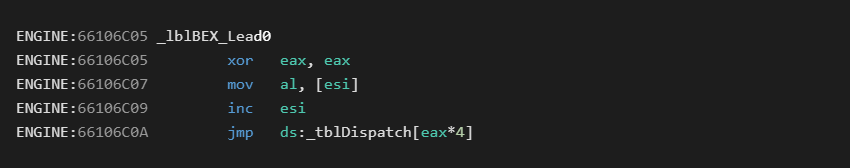
Here we see EAX zeroed out, the next opcode byte loaded into AL and the byte code pointer (ESI) incremented. Finally it uses that new opcode to jump into an entirely different function pointer table.
This would give us a maximum opcode count of (6*256)-5 or 1531 opcodes.
Now luckily, not all of these opcodes are defined. Remember some slots are invalid, and some are duplicate entries. If we go through and eliminate the noise, we are left with around 822 unique handlers. Still nothing to sneeze at.
So what the above tells us is that not all instructions can be represented as a single opcode. Many instructions will be prefixed with a lead byte that then makes the actual opcode reference a different function pointer table.
Here is a clip from the second tblDispatch pointer table:
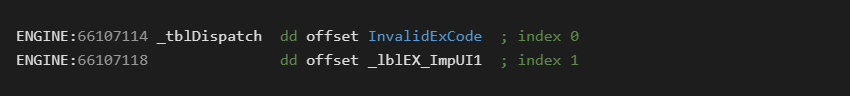
To reach lblEX_ImpUI1 we would need to encode 0xFB as the lead byte and 0x01 as the opcode byte.
This would first send execution into the _lblBEX_Lead0 handler, which then loads the 0x01 opcode and uses tblDispatch table to execute lblEX_ImpUI1.
A little bit confusing, but once you see it in action it becomes quite clear. You can watch it run live for yourself by loading a P-Code executable into a native debugger and setting a breakpoint on the lead* handlers.
Byte stream argument length
Before we can disassemble a byte stream, we also need to know how many byte code arguments each and every instruction takes. With 822 instructions this can be a big job! Luckily other reversers have already done much of the work for us. The first place I saw this table published was from Mr Silver and Mr Snow in the WKTVBDE help file.
A codified version of this can be found in the Semi-VbDecompiler source [2] which I have used as a reference implementation. The opcode sizes are largely correct in this table, however some errors are still present. As with any reversing task, refinement is a process of trial and error.
Some instructions, 18 known to date, have variable length byte stream arguments. The actual size of the byte stream to consume before the next opcode is embedded as the two bytes after the opcode. An example of this is the FFreeVar instruction.
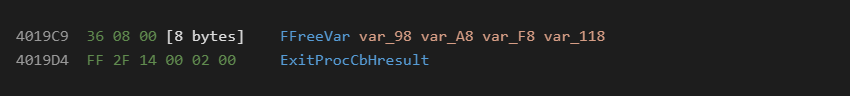
In this example we see the first two bytes decode as 0x0008 (little endian format), which here represents 4 stack variables to free.
Opcode Naming Conventions
Before we continue on to opcode arguments, I will give a brief word on naming conventions and opcode groupings.
In the opcode names you will often see a combination of the following abbreviations. The below is my current interpretation of the less intuitive specifiers:
| Opcode abbreviation | Description |
| Imp | Import |
| Ad | Address |
| St / Ld | Store / Load |
| I2 | Integer/Boolean |
| I4 | Long |
| UI1 | Byte |
| Lit | Literal(ie “Hi”,2,8 ) |
| Cy | Currency |
| R4 | Single |
| R8 | Double |
| Str | String |
| Fn | Calls a VBA export function |
| FPR | Floating point register |
| PR | Uses ebp-4C as a general register |
| Var | Variant |
| Rf | Reference |
| VCall | VTable call |
| LateID | Late bound COM object call by method ID |
| LateNamed | Late bound COM Object call by method name |
Specifiers are often combined to denote meaning and opcodes often come in groups such as the following:

An opcode search interface such as this is very handy while learning the VB6 instruction set.
Opcode Groups
The following shows an example grouping:
| Opcode abbreviation | Description |
| ForUI1 | Start For loop with byte as counter type |
| ForI2 | With integer counter, default step = 1 |
| ForI4 | Long type as counter |
| ForR4 | |
| ForR8 | |
| ForCy | |
| ForVar | |
| ForStepUI1 | For loop with byte counter, user specified step |
| ForStepI2 | |
| ForStepI4 | |
| ForStepR4 | |
| ForStepR8 | |
| ForStepCy | |
| ForStepVar | |
| ForEachCollVar | For each loop over collection using variant |
| ForEachAryVar | For each loop over array using variant |
| ForEachCollObj | For each loop over collection using object type |
| ForEachCollAd | |
| ForEachVar | |
| ForEachVarFree |
A two part series on the intricacies of how For loops were implemented is available [3] for the curious.
As you can see, the opcode set can collapse down fairly well once you take into account the various groupings. While I have grouped the instructions in the source, I do not have an exact number as the lines between them can still be a bit fuzzy. It is probably around 100 distinct operations once grouped.
Now onto the task of argument decodings. I am not sure why, but most P-Code tools only show you the lead byte, opcode byte, mnemonic. Resolved arguments are only displayed if it is fully handled.
Everything except Semi-VBDecompiler [6] skips the display of the argument bytes.
The problem arises from the fact no tool decodes all of the arguments correctly for all of the opcodes yet. If you do not see the argument byte stream, there is no indication other than a subtle jump in virtual address that anything has been hidden from you.
Consider the following displays:
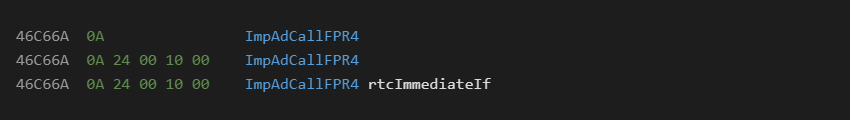
The first version shows you opcode and mnemonic only. You don’t even realize anything is missing. The second version gives you a bigger hint and at least shows you no argument resolution is occurring. The third version decodes the byte stream arguments, and resolves the function call to a usable name.
Obviously the third version is the gold standard we should expect from a disassembler. The second version can be acceptable and shows something is missing. The first version leaves you clueless. If you are not already intimately familiar with the instruction set, you will never know you are missing anything.
Common opcode argument types
In the Semi-VbDecompiler source many opcodes are handled with custom printf type specifiers [4]. Common specifiers include:
| Format specifier | Description |
| %a | Local argument |
| %l | Jump location |
| %c | Proc / global var address stored in constant pool |
| %e | Pool index as P-Code proc to call |
| %x | Pool index to locate external API call |
| %s | Pool index of string address |
| %1/2/4 | Literal byte, int, or long value |
| %t | Code object from its base offset |
| %v | VTable call |
| %} | End of procedure |
Many opcodes only take one or more simple arguments, %a and %s being the most common.
Consider "LitVarStr %a %s" which loads a variant with a literal BSTR string, and then pushes that address to the top of the stack:

The %a decoder will read the first two bytes from the stream and decode it as follows:
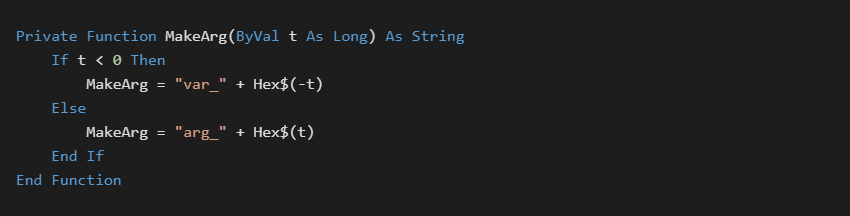
Interpreting 0xFF68 as a signed 2 byte number is -0x98. Since it is a negative value, it is a local function variable at ebp-0x98. Positive values denote function arguments.
Next the %s handler will read the next two bytes which it interprets as a pool index. The value at pool index 0 is the constant 0x40122C. This address contains an embedded BSTR where the address points to the unicode part of the string, and the preceding 4 bytes denoting its length.
A closer look at run time data for this instruction is included in the debugging section later on.
Another common specifier is the %l handler used for jump calculations. It can be seen in the following examples:
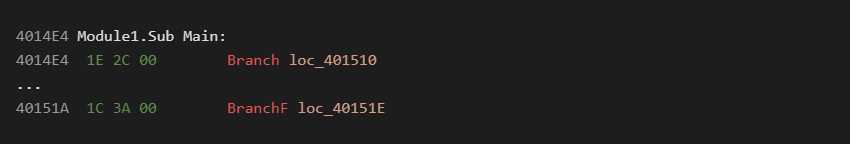
In the first unconditional jump the byte stream argument is 0x002C. Jump locations are all referenced from the function start address, not the current instruction address as may be expected.
0x4014E4 + 0x2C = 0x401510
0x4014E4 + 0x3A = 0x40151E
Since all jumps are calculated from the beginning of a function, the offsets in the byte stream must be interpreted as unsigned values. Jumps to addresses before the function start are not possible and represent a disassembly error.
Next lets consider the %x handler as we revisit the "ImpAdCallFPR4 %x" instruction:

The native handler for this is:
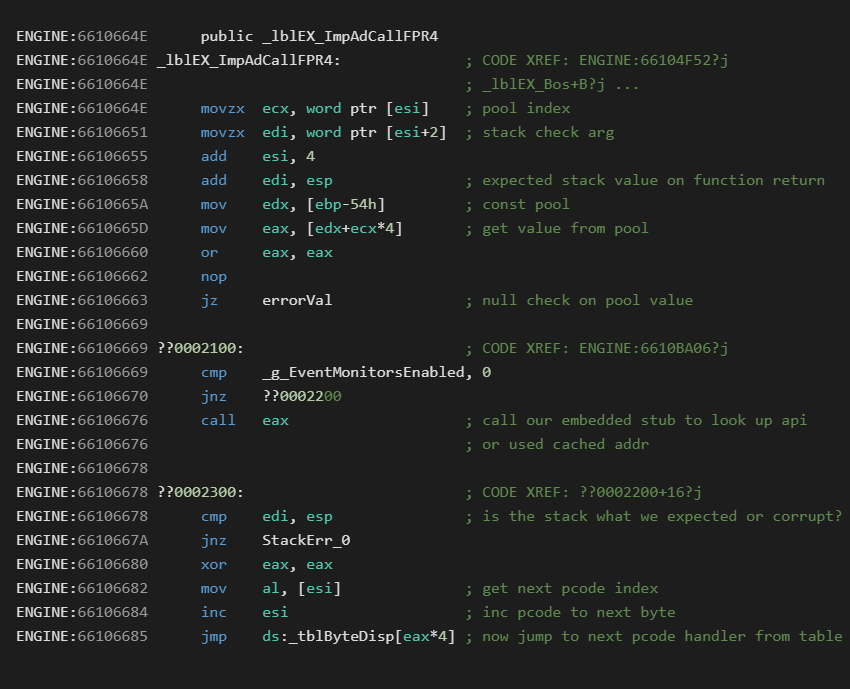
Looking at the P-Code disassembly we can see the byte stream of 24001000 is actually two integer values. The first 0x0024 is a constant pool index, and the second 0x0010 is the expected stack adjustment to verify after the call.
Now we haven’t yet talked about the constant pool or the house keeping area of the stack that VB6 reserves for state storage. For an abbreviated description, at runtime VB uses the area between ebp and ebp-94h as kind of a scratch pad. The meaning of all of these fields are not yet fully known however several of the key entries are as follows:
| Stack position | Description |
| ebp-58 | Current function start address |
| ebp-54 | Constant pool |
| ebp-50 | Current function raw address (RTMI structure) |
| ebp-4C | PR (Pointer Register) used for Object references |
In the above disassembly we can see entry 0x24 from the constant pool would be loaded.
A constant pool viewer is a very instructive tool to help decipher these argument byte codes.
It has been found that smart decoding routines can reliably decipher constant pool data independent of analysis of the actual disassembly.
One such implementation is shown below:

If we look at entry 0x0024 we see it holds the value 0x4011CE. If we look at this address in IDA we find the following native disassembly:

0x40110C is the IAT address of msvbvm60.rtcImmediateIf import. This opcode is how VB runtime imports are called.
While beyond the scope of this paper, it is of interest to note that VB6 embeds a series of small native stubs in P-Code executables to splice together the native and P-Code executions. This is done for API calls, call backs, inter-modular calls etc.
The Constant Pool
The constant pool itself is worth a bit of discussion. Each compilation unit such as a module, class, form etc gets its own constant pool which is shared for all of the functions in that file.
Pool entries are built up on demand as the file is processed by the compiler from top to bottom.
The constant pool can contain several types of entries such as:
- string values (BSTRs specifically)
- VB method native call stubs
- API import native call stubs
- COM GUIDs
- COM CLSID / IID pairs held in COMDEF structures
- CodeObject base offsets
- blank slots which represent internal COM objects filled out at startup by the runtime (ex: App.)
More advanced opcode processors
More complex argument resolutions require a series of opcode post processors. In the disassembly engine I am working on there are currently 13 post processors which handle around 30 more involved opcodes.
Things start to get much more complex when we deal with COM object calls. Here we have to resolve the COM class ID, interface ID, and discern its complete VTable layout to determine which method is going to be called. This requires access to the COM objects type library if its an external type, and the ability to recreate its function prototype from that information.
For internal types such as user classes, forms and user controls, we also need to understand their VTable layout. For internal types however we do not receive the aid of tlb files. Public methods will have their names embedded in the VB file format structures which can be of help.
Resolution of these types of calls is beyond the scope of what we can cover in an introductory paper, but it is absolutely critical to get right if you are writing a disassembler that people are going to rely upon for business needs.
More on opcode handler inputs
Back to opcode arguments. It is also important to understand that opcodes can take dynamic runtime stack arguments in addition to the hard coded byte stream arguments. This is not something that a disassembler necessarily needs to understand though. This level of knowledge is mainly required to write P-Code assembly or a P-Code decompiler.
Some special cases however do require the context of the previous disassembly in order to resolve properly. Consider the following multistep operation:

Here the LateIdLdVar resolver needs to know which object is being accessed. Scanning back and locating the VCallAd instruction is required to find the active object stored in PR.
Debugging handlers
When trying to figure out complex opcode handlers, it is often helpful to watch the code run live in a debugger. There are numerous techniques available here. Watching the handler itself run requires a native debugger.
Typically you will figure out how to generate the opcode with some VB6 source which you compile. You then put the executable in the same directory as your reference copy of the vb runtime and start debugging.
Some handlers are best viewed in a native debugger, however many can be figured out just by watching it run through a P-Code debugger.
A P-Code debugger simplifies operations showing you its execution at a higher level. In one step of the debugger you can watch multiple stack arguments disappear, and the stack diff light up with changes to other portions. Higher level tools also allow you to view complex data types on the stack as well as examine TLS memory and keep annotated offsets.
In some scenarios you may actually find yourself running both a P-Code debugger and a native debugger on the target process at the same time.
One important thing to keep in mind is that VB6 makes heavy use of COM types.
Going back to our LitVarStr example:

You would see the following after it executes:
0019FC28 ebp-120 0x0019FCB0 ; ebp-98 - top of stack
...
0019FCB0 ebp-98 0x00000008
0019FCB4 ebp-94 0x00000000
0019FCB8 ebp-90 0x0040122C
A data viewer would reveal the following when decoding ebp-98 as a variant:
Variant 19FCB0
VT: 0x8( Bstr )
Res1: 0
Res2: 0
Res3: 0
Data: 40122C
String len: 9 -> never hit
Debugging VB6 apps is a whole other ball of wax. I mention it here only in passing to give you a brief introduction to what may be required when deciphering what opcodes are doing. In particular recognizing Variants and SafeArrays in stack data will serve you well when working with VB6 reversing.
Conclusion
In this paper we have laid the necessary ground work in order to understand the basics of a VB6 P-Code disassembly engine. The Semi-VbDecompiler source is a good starting point to understand its inner workings.
We have briefly discussed how to find and read native opcode handlers along with some of the conventions necessary for understanding them. We introduced you to how opcodes flow from one to the next, along with how to determine the number of byte stream arguments each one takes, and how to figure out what they represent.
There is still much work to be done in terms of documenting the instruction set. I have started a project where I catalog:
- VB6 source code required to generate an opcode
- byte stream arguments size and meaning
- stack arguments consumed
- function outputs
Unfortunately it is still vastly incomplete. This level of documentation is foundational and quite necessary for writing any P-Code analysis tools.
Still to be discussed, is how to find the actual P-Code function blobs within the VB6 compiled executable. This is actually a very involved task that requires understanding a series of complex and nested file structures. Again the Semi-VbDecompiler source can guide you through this maze.
While VB6 is an old technology, it is still commonly used for malware. This research is aimed at reducing gaps in understanding around it and is also quite interesting from a language design standpoint.
[1] – VB6 runtime with symbols
[2] – Semi-VbDecompiler opcode table Source
[3] – A closer look at the VB6 For Loop implementation
[4] – Semi-VBDecompiler opcode argument decodings
[5] – Introducing a one byte NOP opcode
[6] – Semi-VBDecompiler